We have all heard how chatbots are going to change the internet world as we know it today. Many of us want to build great conversational bots which will engage in a way never before and solve real life problems, which is all very good. But there is one big problem, the bots are very new, no one surely knows how to design a great conversational flow which will work perfectly for us. That means we need a lot of iterations and experimentation to nail it, which brings us to the question “How do you know what is working and what is not ? How do you measure it? “
At Engati we have tried to arm you with a bunch of very useful and pertinent metrics that will help you to do just that. We help you to improve the human bot interaction by measuring engagement and retention, observing conversation, identifying bottlenecks and identifying and improving the content quality. I will try to explain briefly what are these metrics and how they can help you.
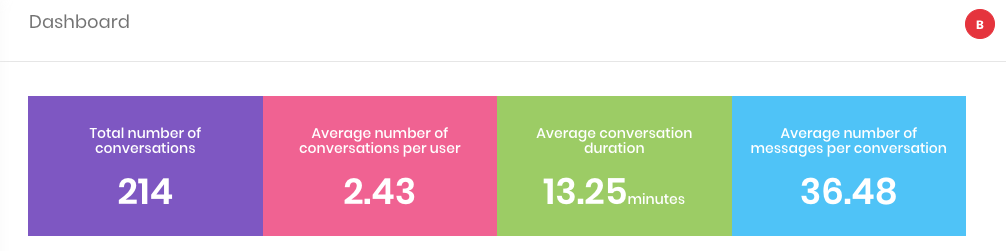
The Dashboard
The Dashboard provides a quick overview to the bot admins of how the bot is performing across the various platforms configured. The fundamental unit we use is called interactions, which is single to and fro communication between the bot and user. There is another metric that is used often is conversation, a metric which is very similar to the idea of “session” but for bots.
The dashboard shows you 4 different metrics
– The first metric is straightforward, it gives the total no of conversations the bot had so far
– Average Conversations per user is going to give you an idea of how successful your content is, in bringing back the user to the bot. A very crude measure of retention.
– The next two metrics will give a measure of how engaging your bot content is. Average conversation length and no of messages per conversation tells you for how long an average conversation in bot goes on and how many interactions has the end user made with it. With good engaging content your bots conversation should last longer and more messages will be exchanged.
– The next two metrics will give a measure of how engaging your bot content is. Average conversation length and no of messages per conversation tells you for how long an average conversation in bot goes on and how many interactions has the end user made with it. With good engaging content your bots conversation should last longer and more messages will be exchanged.
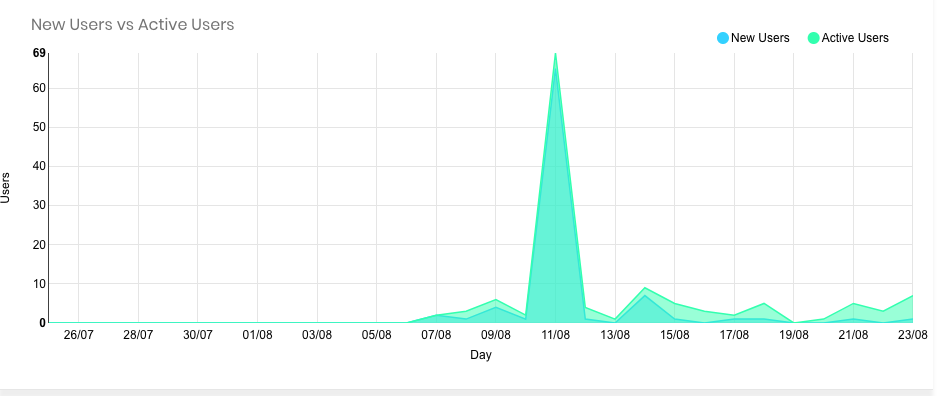
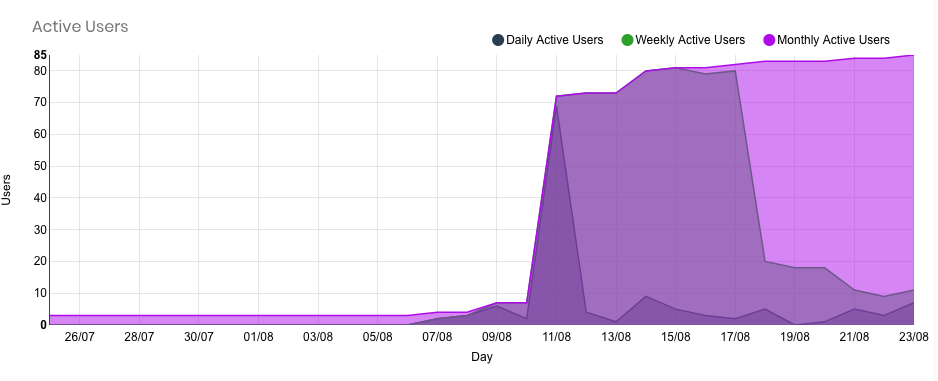
The two info-graphs are focused on new users coming in and the active users on the bot. There are filters like weekly monthly and daily. They give a clear picture of the user acquisition and user retention trends over the past month, during which day of the month and the week are we getting more users and active users. We can also track the dip or increase in user acquisition and active users and correlate them well with the changes made in the bot in and around that period.
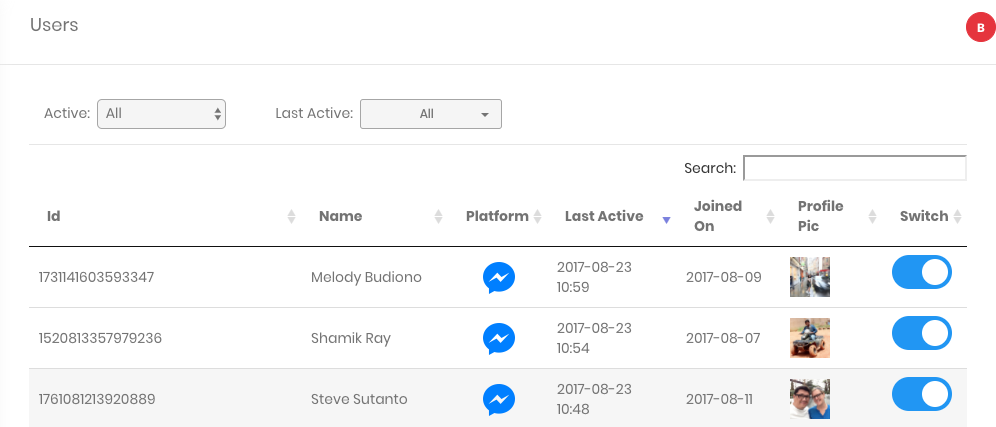
User Details
The Individual user screen comes when you click on a specific user on the users tab. It helps you drill down to a specific user and do a one to one chat when needed. The screen provides you some basic user specific details, which might come in handy during a conversation with the user, and also a very detailed conversation history of the user. The conversation history helps you to catch up quickly with the context of conversation that the user had with your bot. It will also help you identify bottlenecks in your bot content which is probably driving away or causing a negative experience for end users.
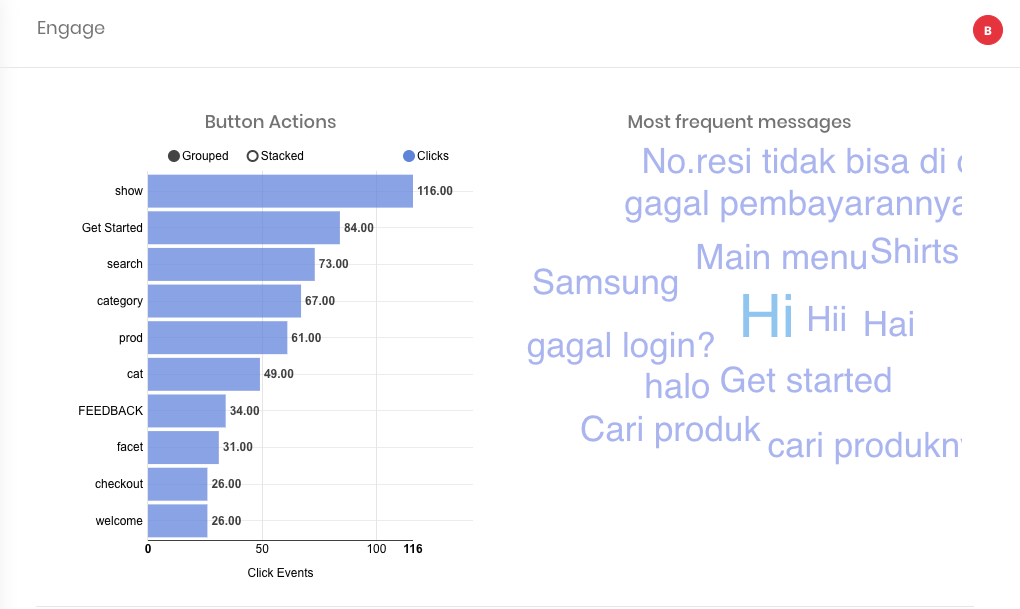
Engage and Retention
The Engage tab provides a nice overview of what your users are doing on your bot. What are they clicking and what are they searching for, It tells you which of your conversation tracks /paths are popular among the users and taken mostly. Using these stats you can figure out the bottlenecks in your conversation flow where things are fizzling out.
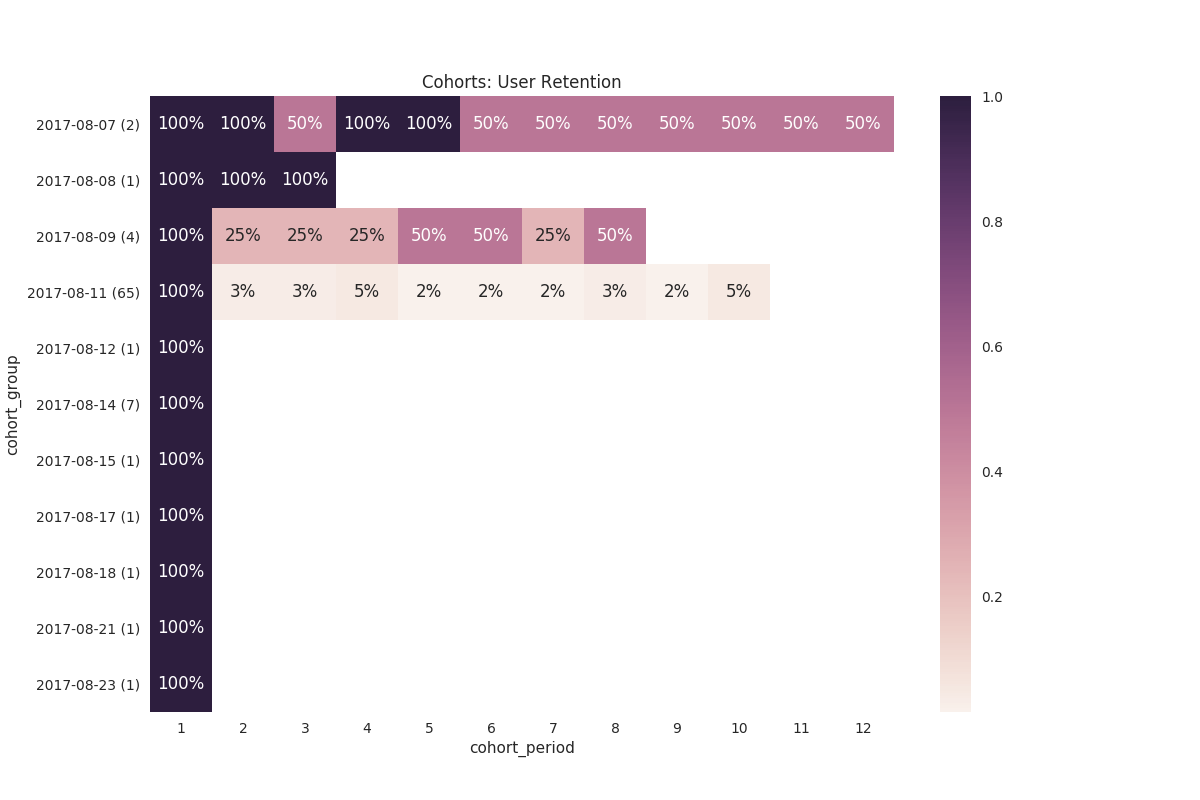
The cohort graph on retention tab provides insights on retention of your user’s, what percentage of people are revisiting the bot in the next fortnight after the first visit. Using it you can make inferences on user behaviour and find correlations with changes in bot content and make improvements accordingly.
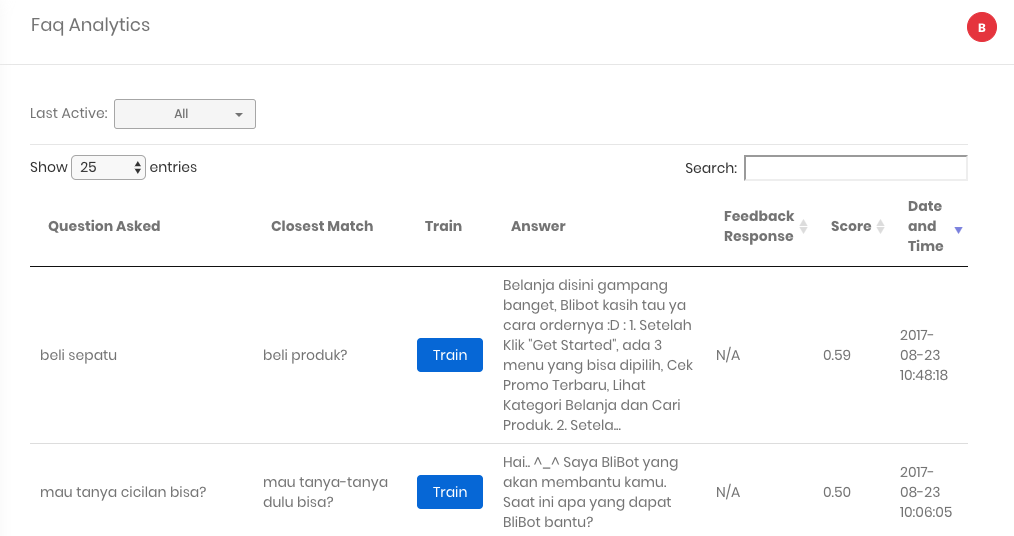
FAQ Analytics
This tab is there to help you train your bot based on the feedback received from your customers. Your bot won’t have all the information from the word go, but you can always come here to feed the correct information. Using train, you can add missed queries and help the bot AI to find better answers in future. We also provide you with handy filters and text search.
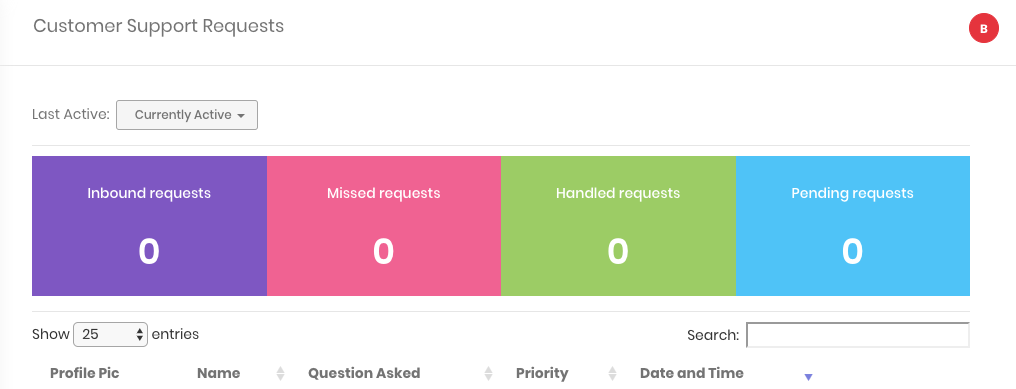
Customer support and Live chat dashboard
This module is not present out of the box but available on demand. As the name suggests it’s a real time chat module tailor made for your customer support team. This screen allows you to quickly handle the issues your customers might be facing with easy switching between the live agent and the bot.
All the metrics and data on these two screens will make the life easy for your support agents. On screen you get the data which triggered the customer support request based on which you decide whether to take up a request or not. And once a request is taken up, you are redirected to the chat screen which provides you the same information you get in user details screen to help you have a meaningful conversation and resolve the issue. The Customer Support Dashboard also provides a quick overview of the requests received, pending, handled and missed by the Customer agents.
Thank you for reading. Cheers to building more awesome bots!
